6.s081 Lab: System Calls
Before you start coding, read Chapter 2 of the xv6 book, and Sections 4.3 and 4.4 of Chapter 4, and related source files.
Using GDB
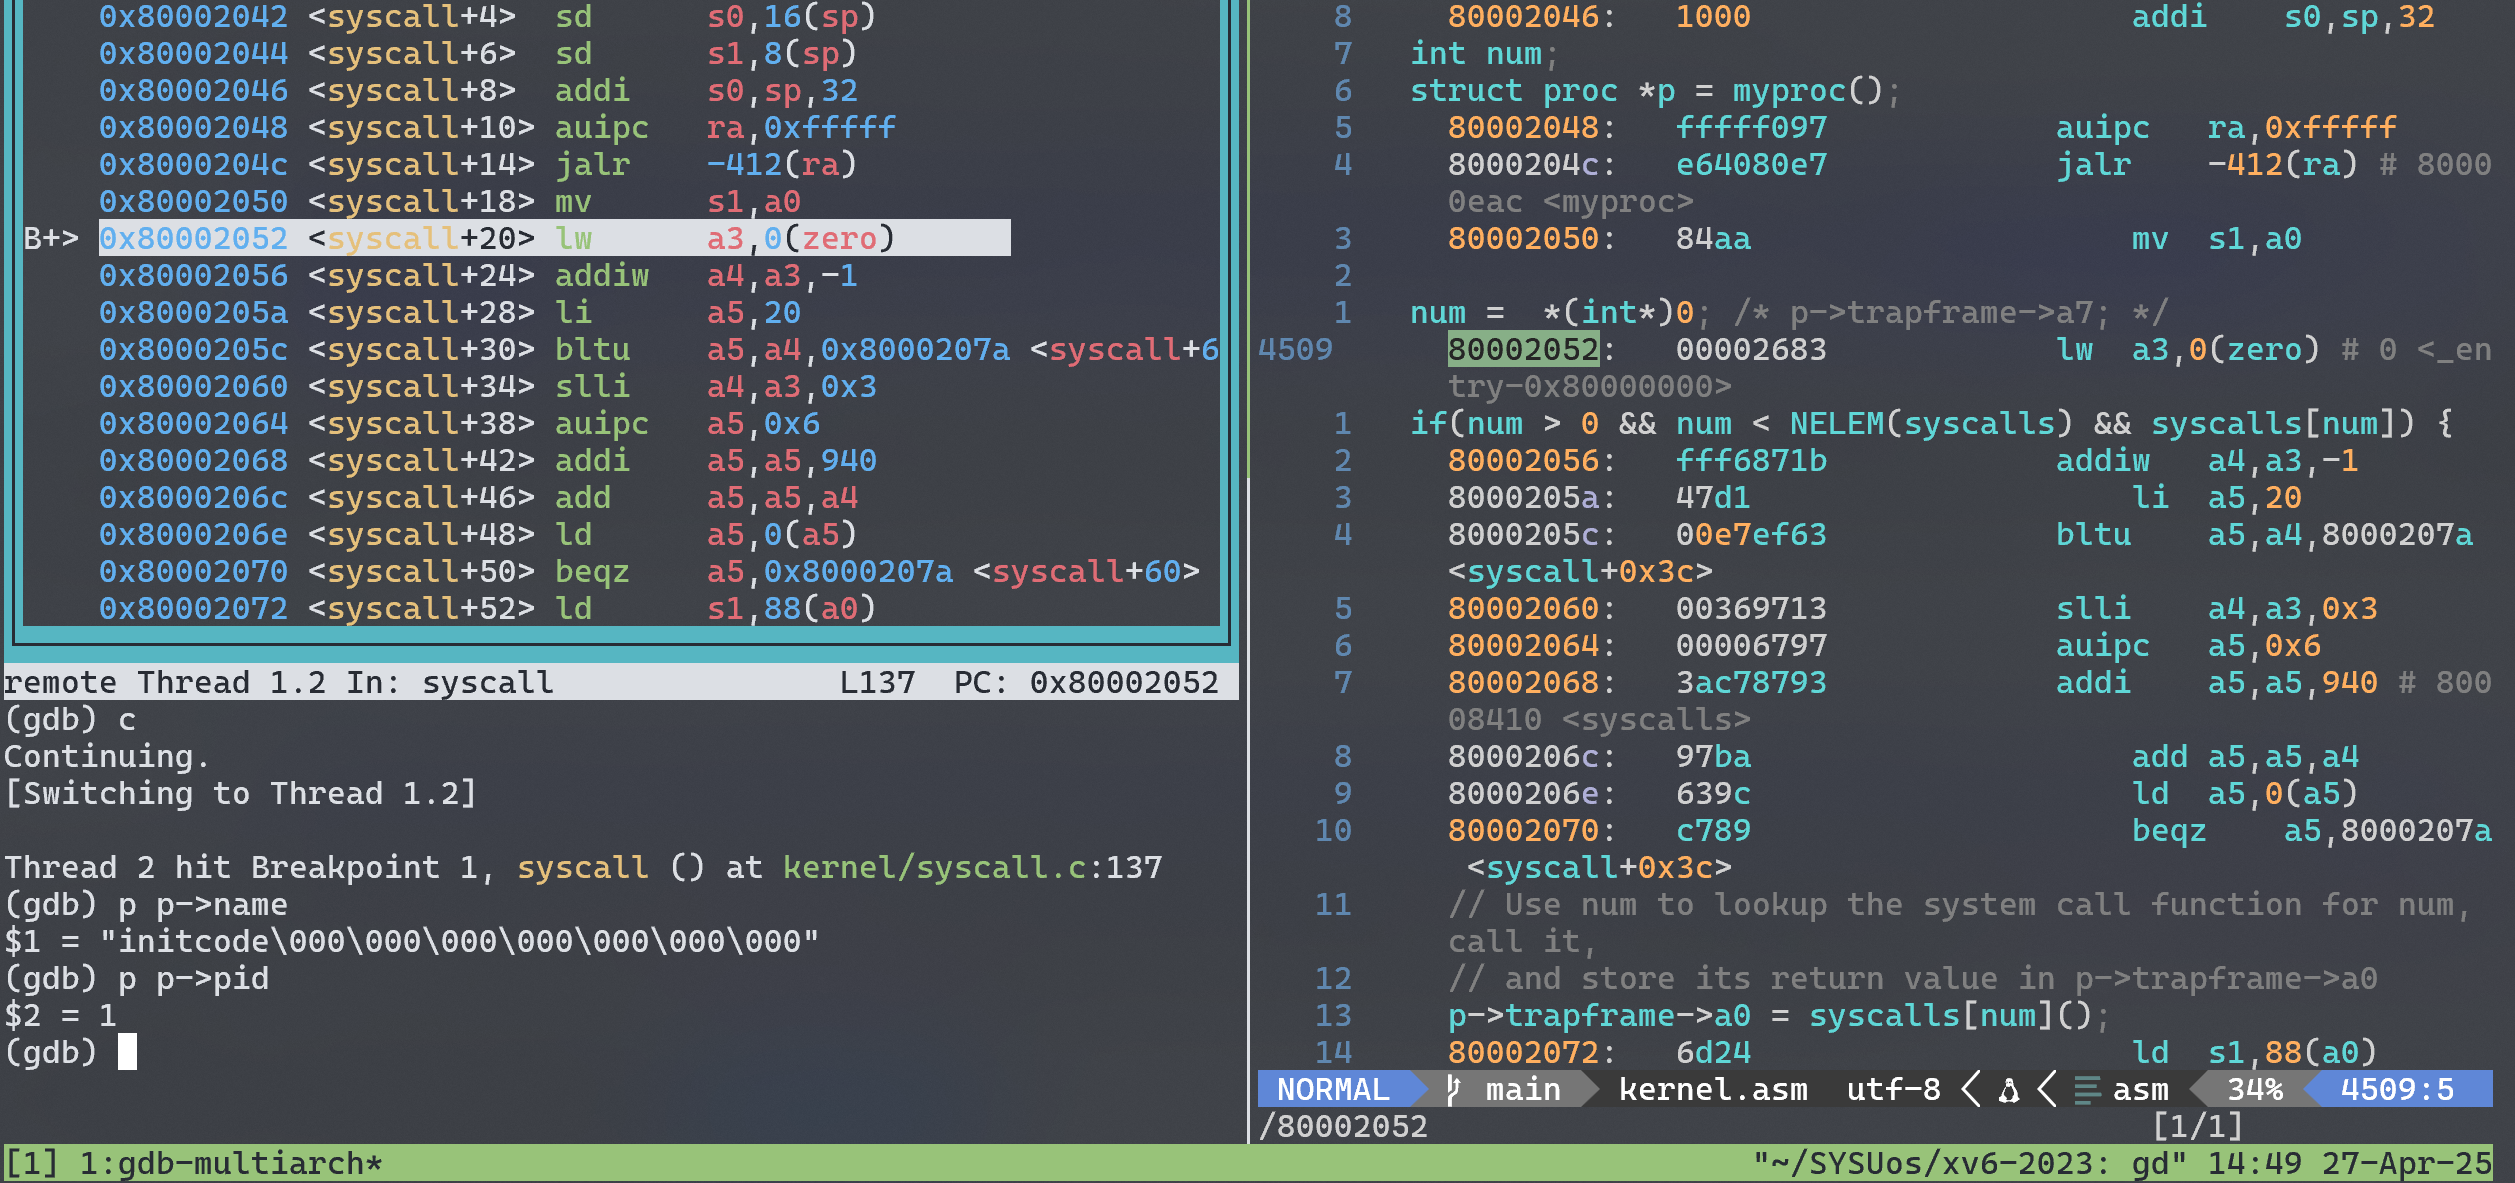
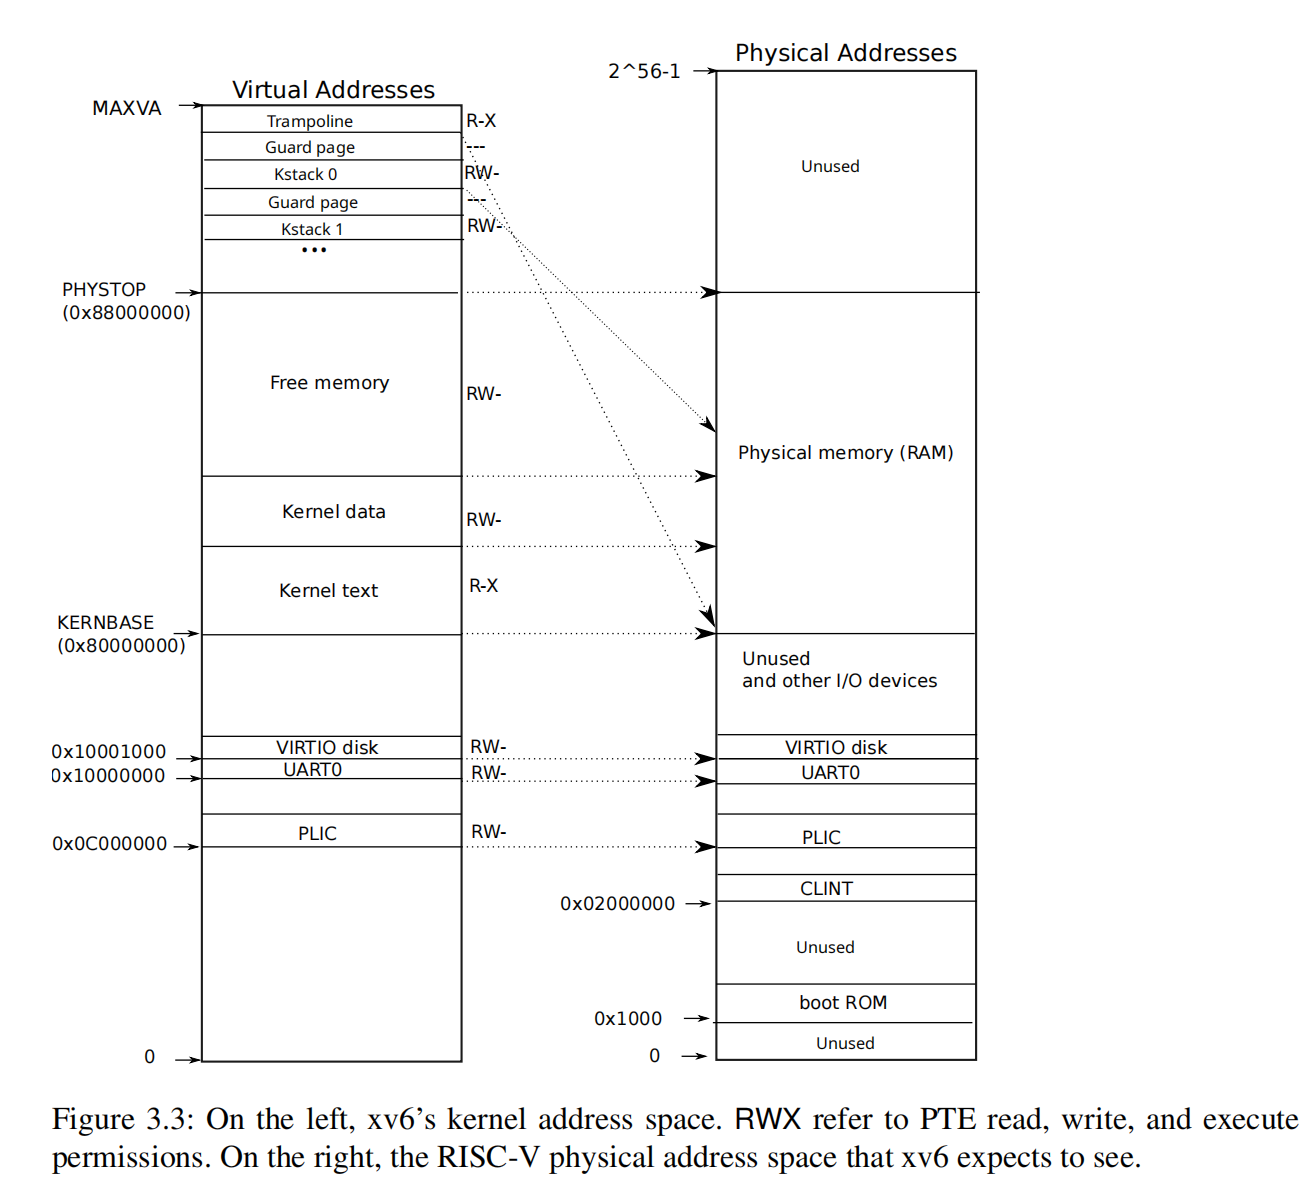
这一小节主要是通过故意修改syscall.c中的 syscall 编号为 *(int*)0发生 kernel panic,以此学习 GDB 的基础用法。查看 kernel 虚拟内存映射关系可以知道 0x00 这个位置根本没有映射到物理内存的页,因此读取这个内存虚拟地址的数据会发生缺页(page fault)。
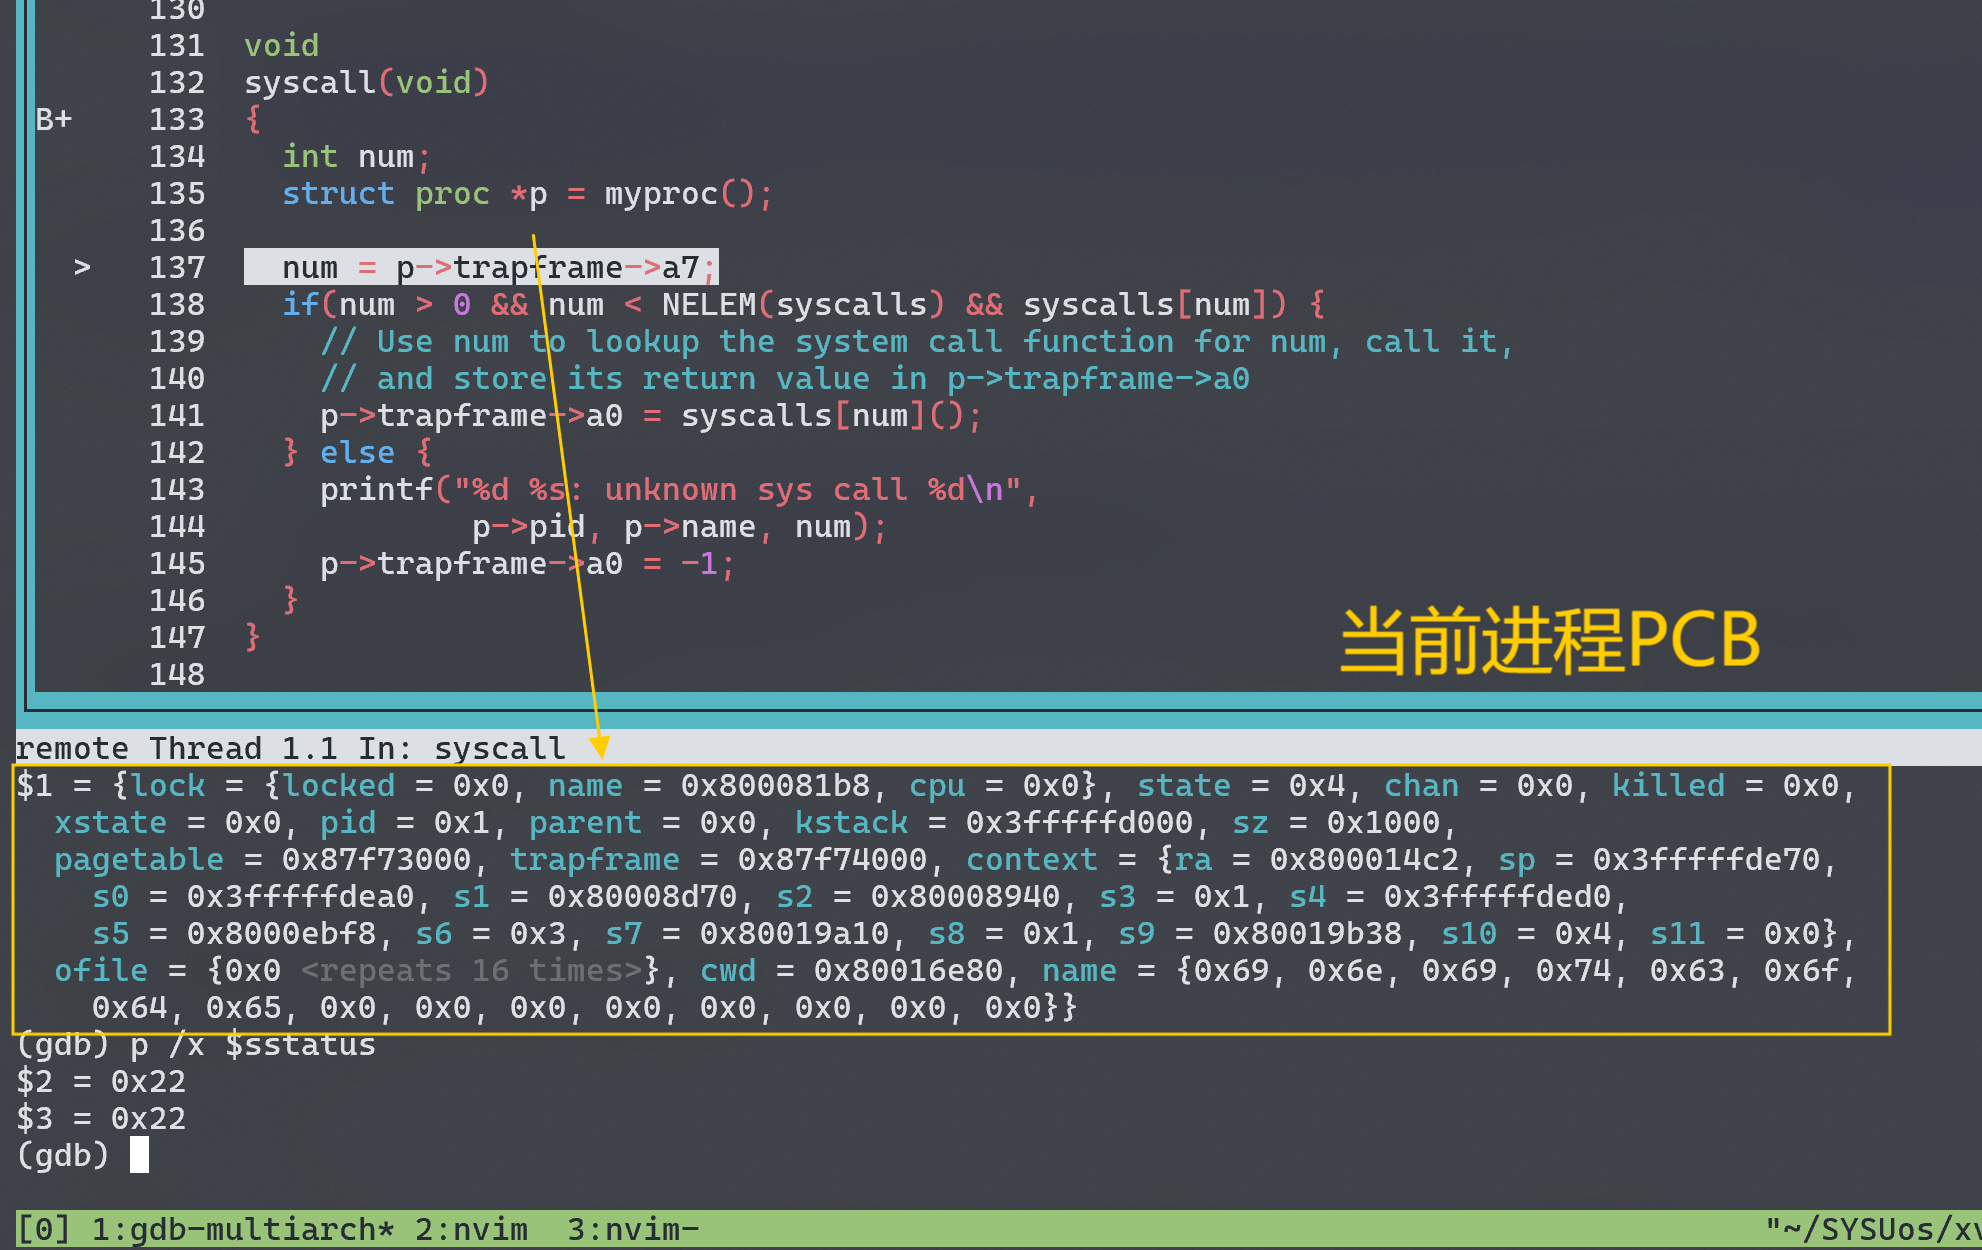
寄存器a3保存 num 变量的值,在 0x80002052 (kernel code)如我们所愿地通过 0(zero)变址寻址到 0x00,发生 page fault。关于缺页错误处理我没有继续 trace 下去,这个任务留到之后的实验中(traps)。
System call tracing
In this assignment you will add a system call tracing feature that may help you when debugging later labs. You’ll create a new
tracesystem call that will control tracing. It should take one argument, an integer “mask”, whose bits specify which system calls to trace. You have to modify the xv6 kernel to print out a line when each system call is about to return, if the system call’s number is set in the mask. The line should contain the process id, the name of the system call and the return value; you don’t need to print the system call arguments. Thetracesystem call should enable tracing for the process that calls it and any children that it subsequently forks, but should not affect other processes.
这个任务需要我们添加一个trace系统调用,通过传入需要跟踪的系统调用编号,trace将会打印出进程对该 syscall 的调用记录。
ps: 为了更好实现这个 syscall ,我们应该对整个系统调用的过程有清晰的认识,即理解用户态系统调用如何跳转到内核 syscall 实现的。这个过程涉及用户态代码、硬件陷阱机制和内核态代码的协同工作,但 trap 在后面的实验才会涉及到,所以在这个任务中我们暂时将中间的一些过程进行抽象,其中的细节过程留到后面的 lab 来学习。
syscall 调用过程如下(以 trace 为例):
-
用户态按照
user/user.h中提供的系统调用接口int trace(int)调用trace(1 << SYS_read)。这个系统调用相当于注册需要跟踪的 syscall。 -
trace()调用user/usys.S中对应的汇编 stub。那么什么是 stub ?Just show me the code!通过下面的汇编我们可以知道符号重定向时会把这段代码 copy 过去,它的任务很简单,即把系统调用编号SYS_trace写入a7寄存器,然后ecall将控制权转移给 kernel 。
1 | .global trace |
ecall指令触发硬件处理逻辑,然后内核处理 trap ,其中过程暂时忽略,最后会调用syscall()这个统一的系统调用接口。syscall()根据系统调用编号在syscalls数组中查找 handler (sys_trace)并调用。
1 | // kernel/syscall.c |
sys_trace即是 kernel 对于这个系统调用的真正实现,文件里的sys_函数是用户程序通过ecall的最终调用目标。在sys_函数中,我们才开始解析 syscall 传递的参数,然后实现具体逻辑。参数解析需要通过kernel/syscall.c提供的argint、argaddr和argfd完成,特殊地还需要使用fetchstr和fetchaddr来完成(这一部分涉及虚拟地址转换,留在下一个 Lab 分析)。
1 | // kernel/sysproc.c |
sys_函数执行后返回给syscall(),继续一路返回到用户态,用户程序从ecall指令之后的那条指令继续执行。
大概理解trace作为一个用户态系统调用的调用过程后,我们来考虑实现逻辑。
首先我们需要修改 struct proc(kernel/proc.c),为每个进程添加一个 mask 字段来记录需要跟踪的系统调用。(其实我感觉 mask 作为 process 的一个状态挺奇怪的,但是我也不知道应该怎么设计比较合理,因此按照 Lab 的提示来进行。)
为了打印出调用指定系统调用的进程信息,我们需要修改syscall():
1 | void syscall(void){ |
我们为每个进程添加了一个 mask 字段,因此还需要修改 fork 系统调用,将 mask 传递给子进程:
1 | // kernel/proc.c |
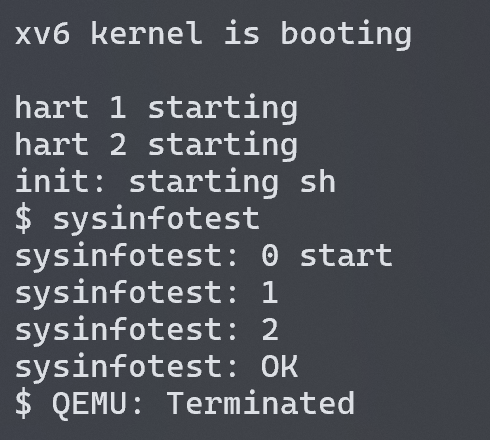
测试结果如下:

Sysinfo
In this assignment you will add a system call,
sysinfo, that collects information about the running system. The system call takes one argument: a pointer to astruct sysinfo(seekernel/sysinfo.h). The kernel should fill out the fields of this struct: thefreememfield should be set to the number of bytes of free memory, and thenprocfield should be set to the number of processes whose state is not UNUSED.
任务要求我们将内核空间中的信息(freemem和nproc)复制到用户空间中的 sysinfo 中,这需要我们使用 copyout() 实现一些 built-in 的内核函数,再利用这些内核函数来实现具体的sys_sysinfo()。对于 copyout 的实现我们还是先不深入分析,以sys_fstat() (kernel/sysfile.c) 和 filestat() (kernel/file.c) 为例来使用它。
实现 sysinfo 需要填充两个字段信息:空余可用的内存大小 freemem 和状态不是 UNUSED 的进程数量 nproc。
freemem
要扫描空余内存大小,我们需要知道 xv6 是如何模拟 RAM 的(巨大数组?)。然而实际上 xv6 并没有模拟 RAM,这个工作由 QEMU 来进行,它模拟了 RAM 这个硬件,让运行在 QEMU 之上的 xv6 操作系统感觉自己是在与硬件交互。比如 xv6 尝试访问物理内存地址 0x80200000,QEMU 会截取这个指令并翻译地址为实际本机的一个物理地址。
xv6 允许分配的物理内存地址范围为:
1 | // kernel/memlayout.h |
kernel/kalloc.c 实现了很多访问物理内存的接口,其中定义了一个 kmem 链表用来保存空闲物理页。
1 | struct run { |
那么我们填充 freemem 字段的 helper function 的逻辑就很清晰了,直接遍历这个页表即可:
1 | // kernel/kalloc.c |
nproc
kernel/proc.c 中定义了数组 struct proc proc[NPROC] 用来管理所有进程。 NPROC 是最大的进程数量,我们直接遍历计算非 UNUSED 的进程数量即可:
1 | // kernel/proc.c |
sys_sysinfo
实现上述两个 helper function 后,我们最终组合实现系统调用 sysinfo。
1 | // kernel/sysproc.c |
第一次实现我参照 sys_fstat() 把 user level 传递的参数 sysinfo 继续传递到 helper funcitons 里面,把填充字段的工作交给底层 utils。这不仅加大了代码的耦合性,而且由于分字段填充使用copyout操作起来并不优雅。因此修改为将 copyout 复制内核信息到用户级的过程移到了 sys_sysinfo 系统调用实现里,两个 helper functions 只负责收集两个字段。